
Internal analytics
All your marketing performance data in one place
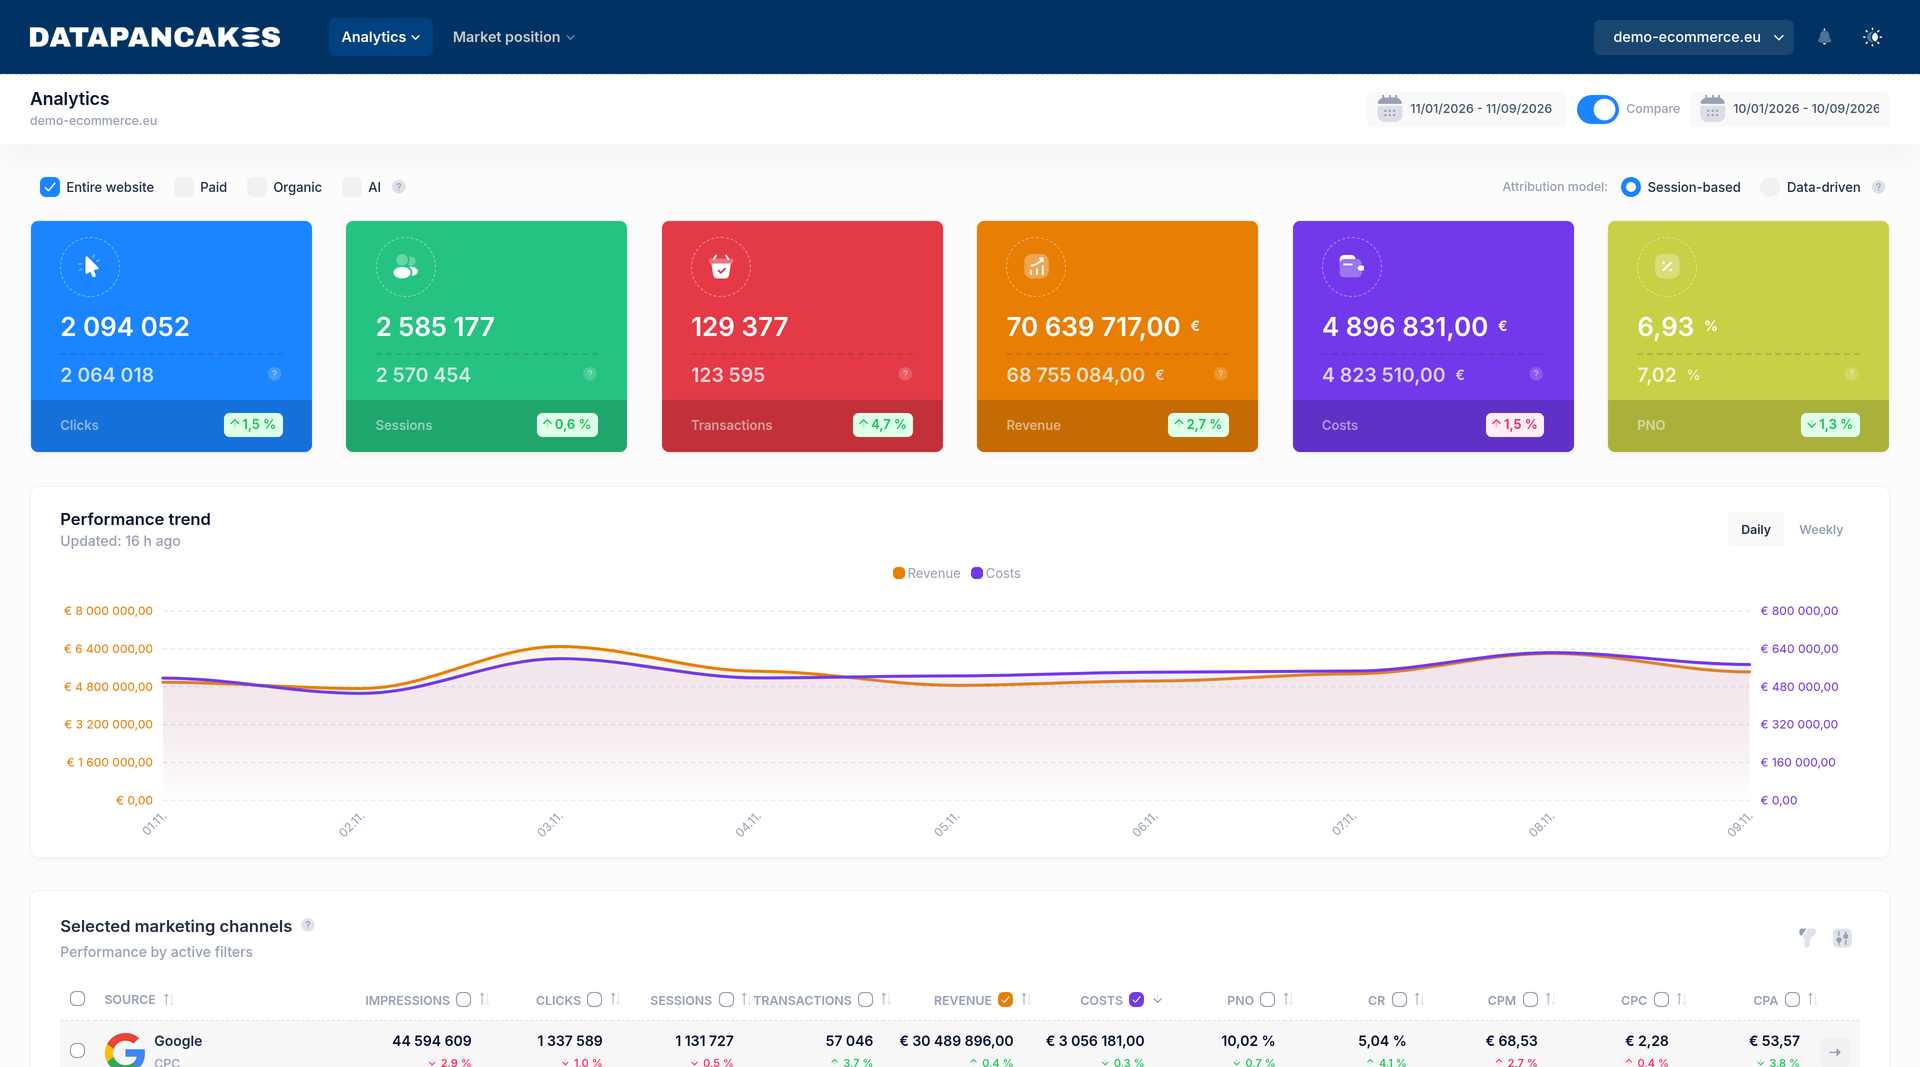
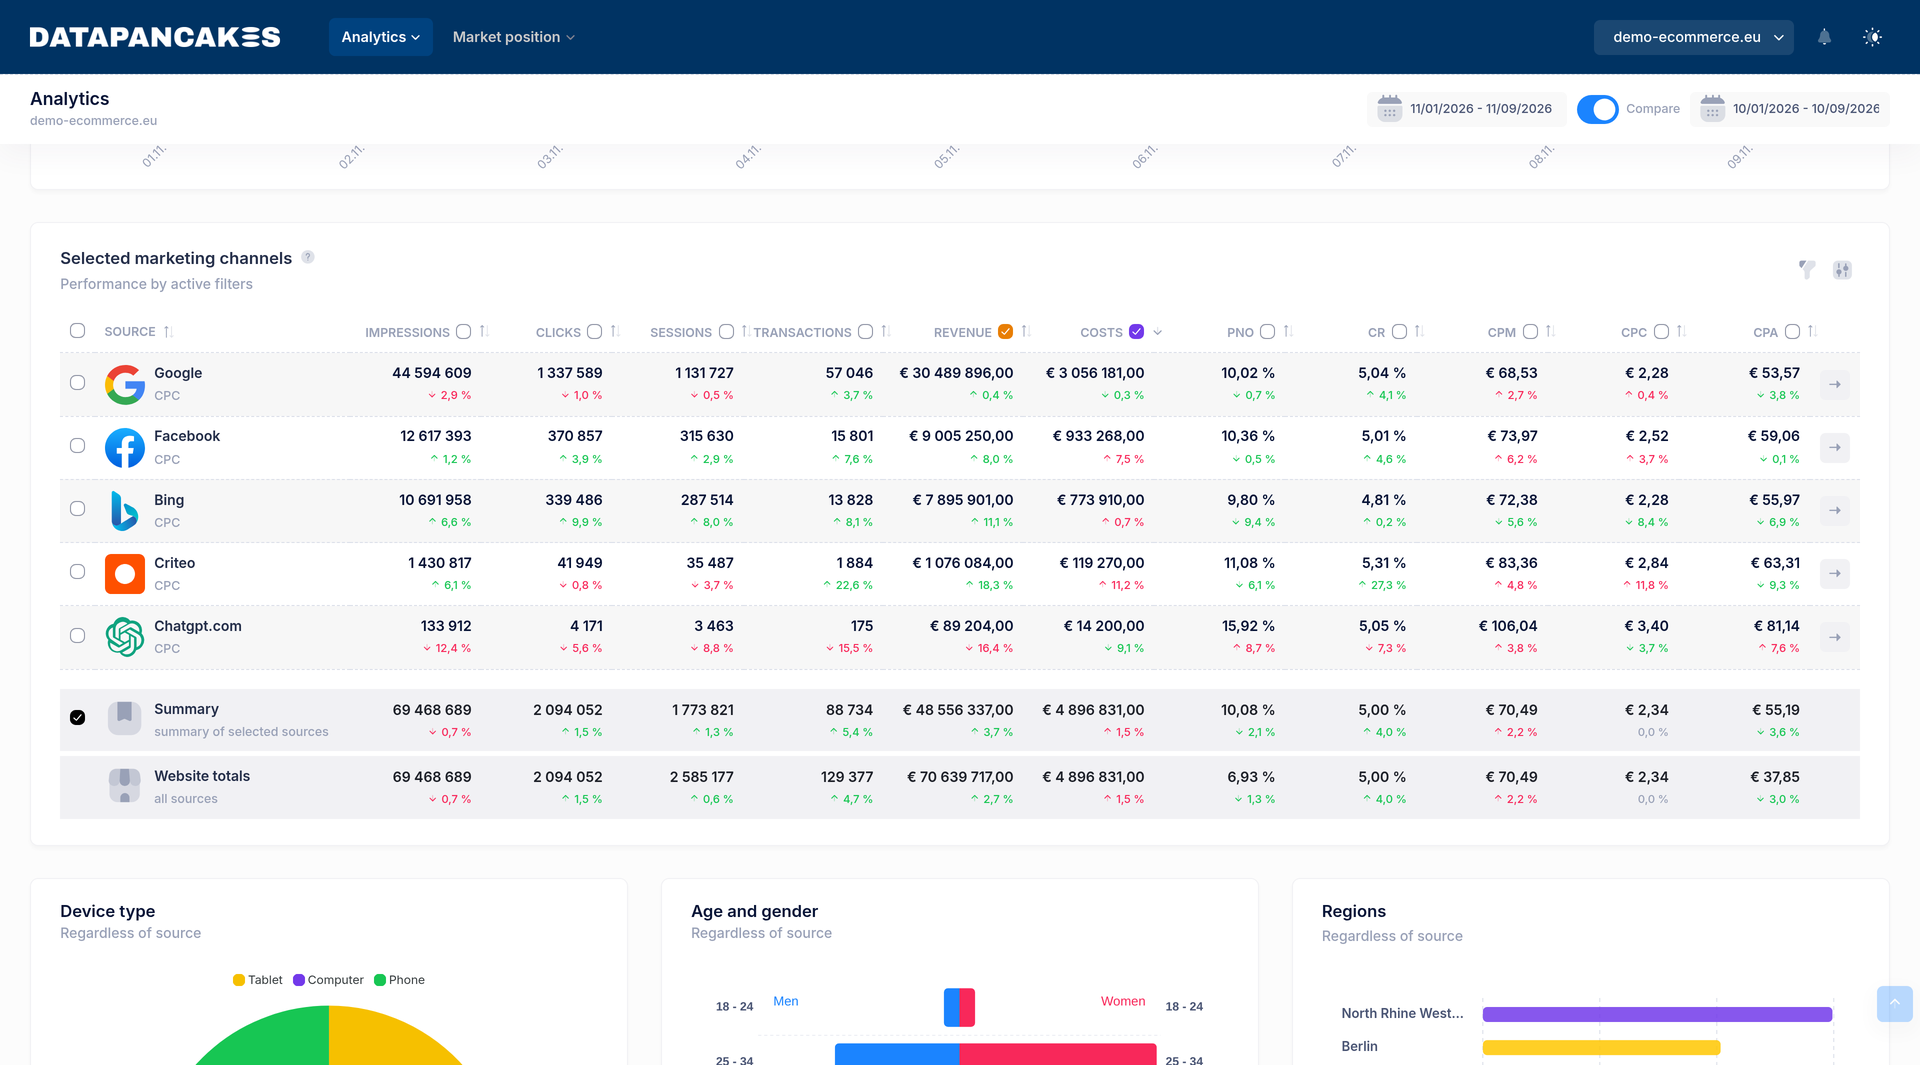
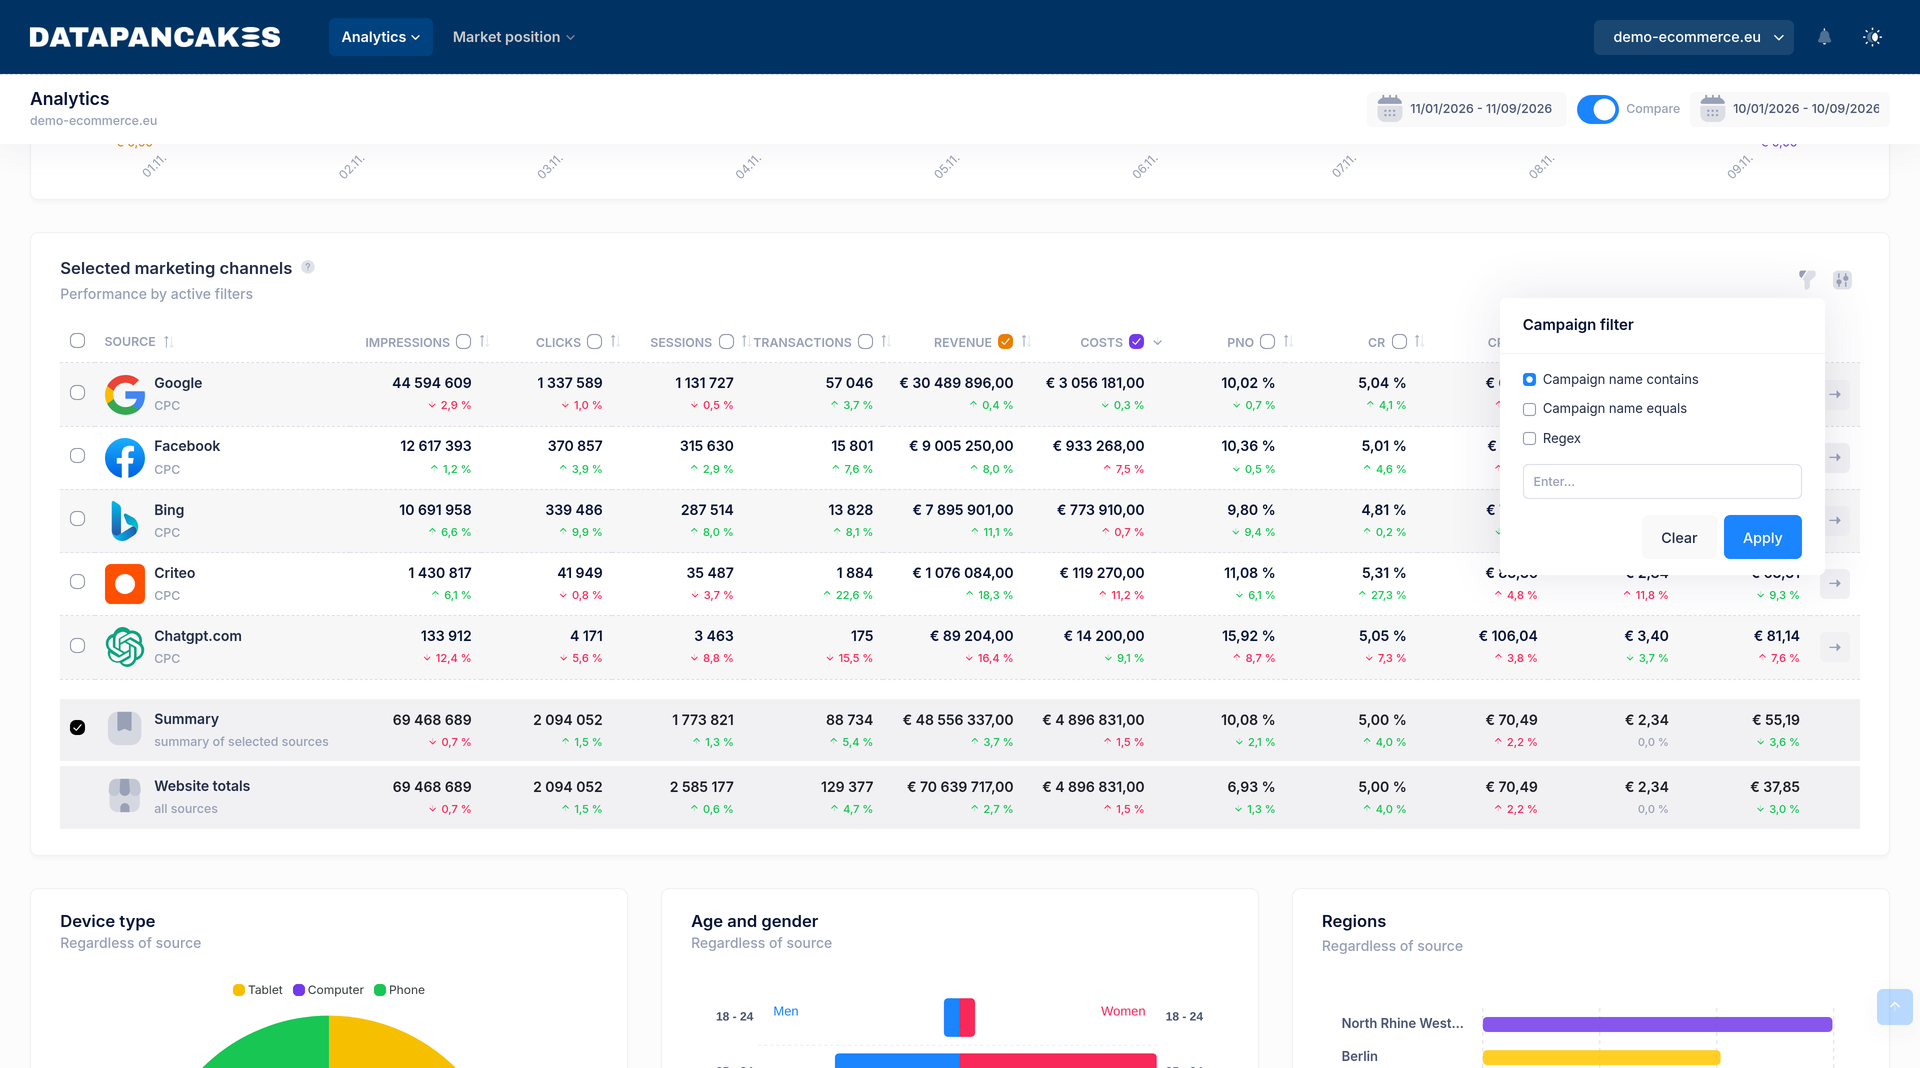
All the data from your ad platforms in one place. The Datapancakes Dashboard gives you a complete view of your online store's performance, with no more switching between GA4 and ad platforms or hunting for logins.
Key features
Unified data
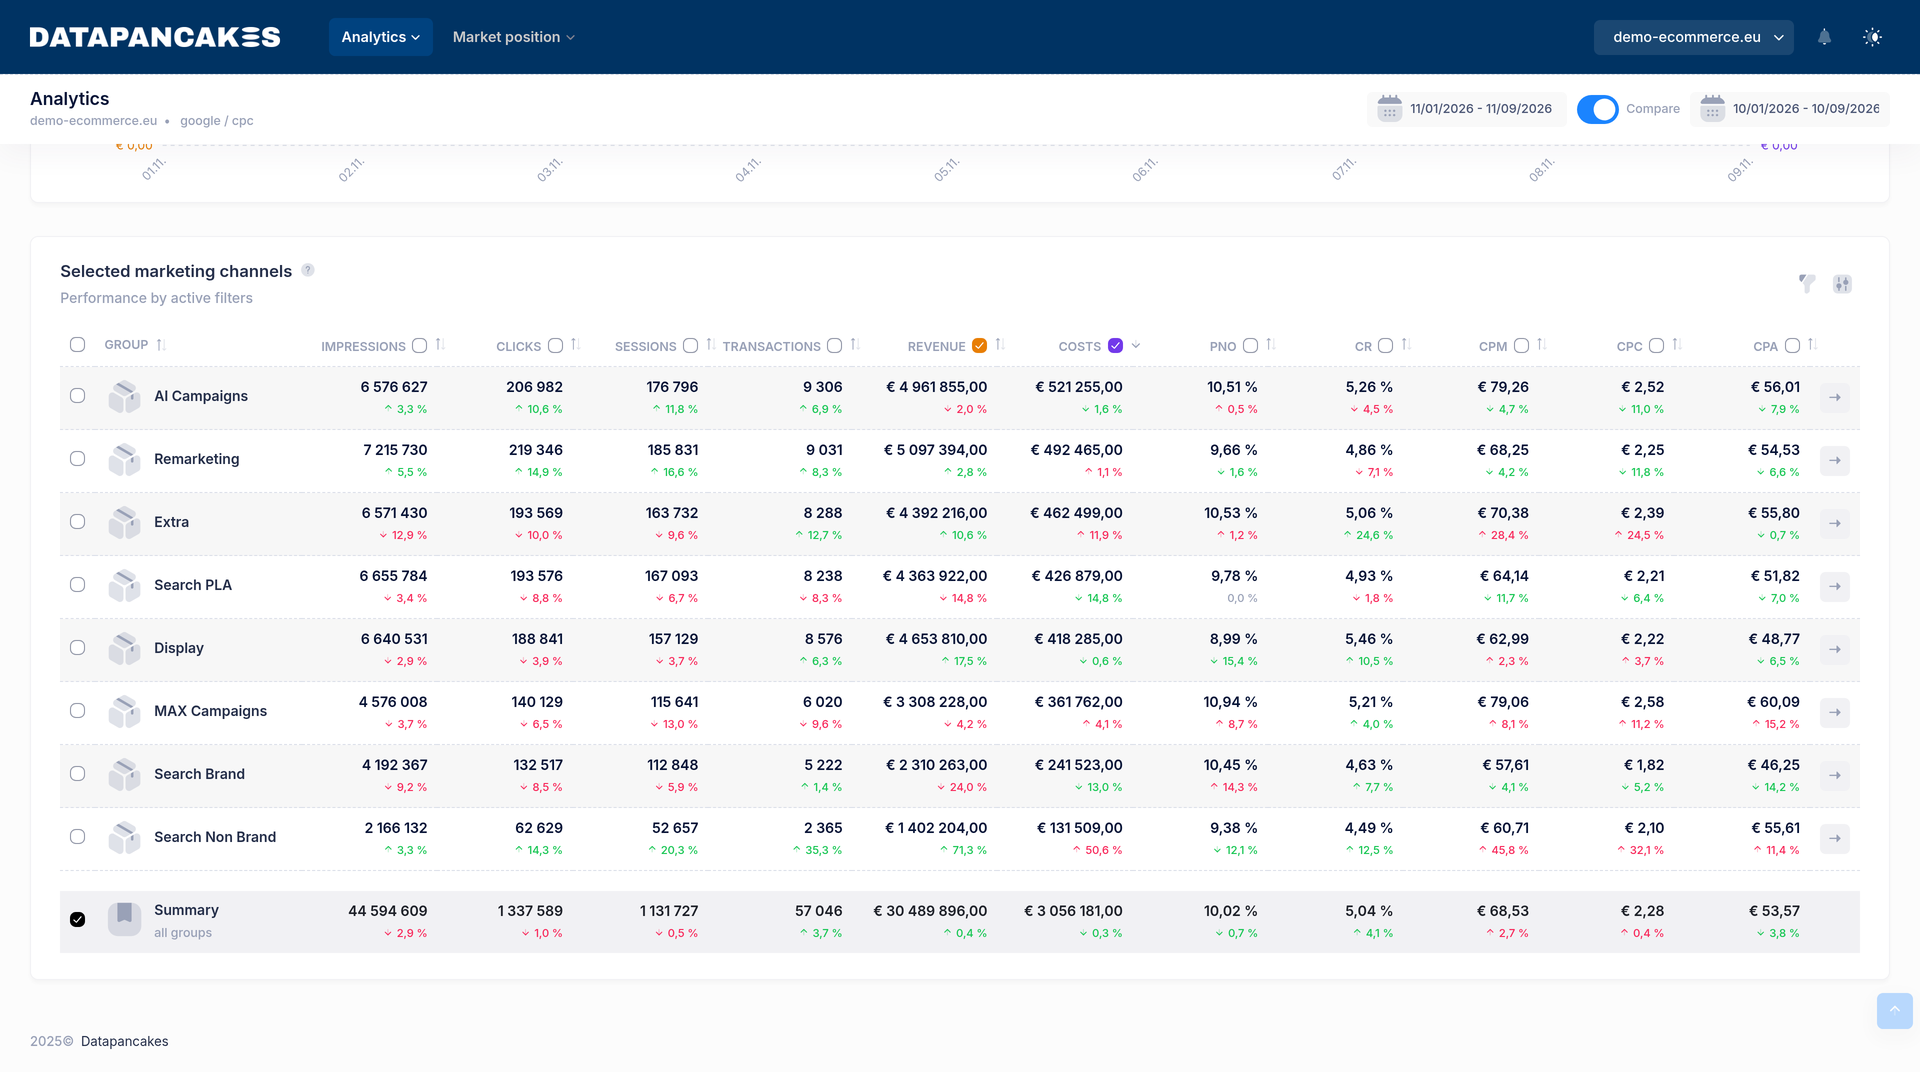
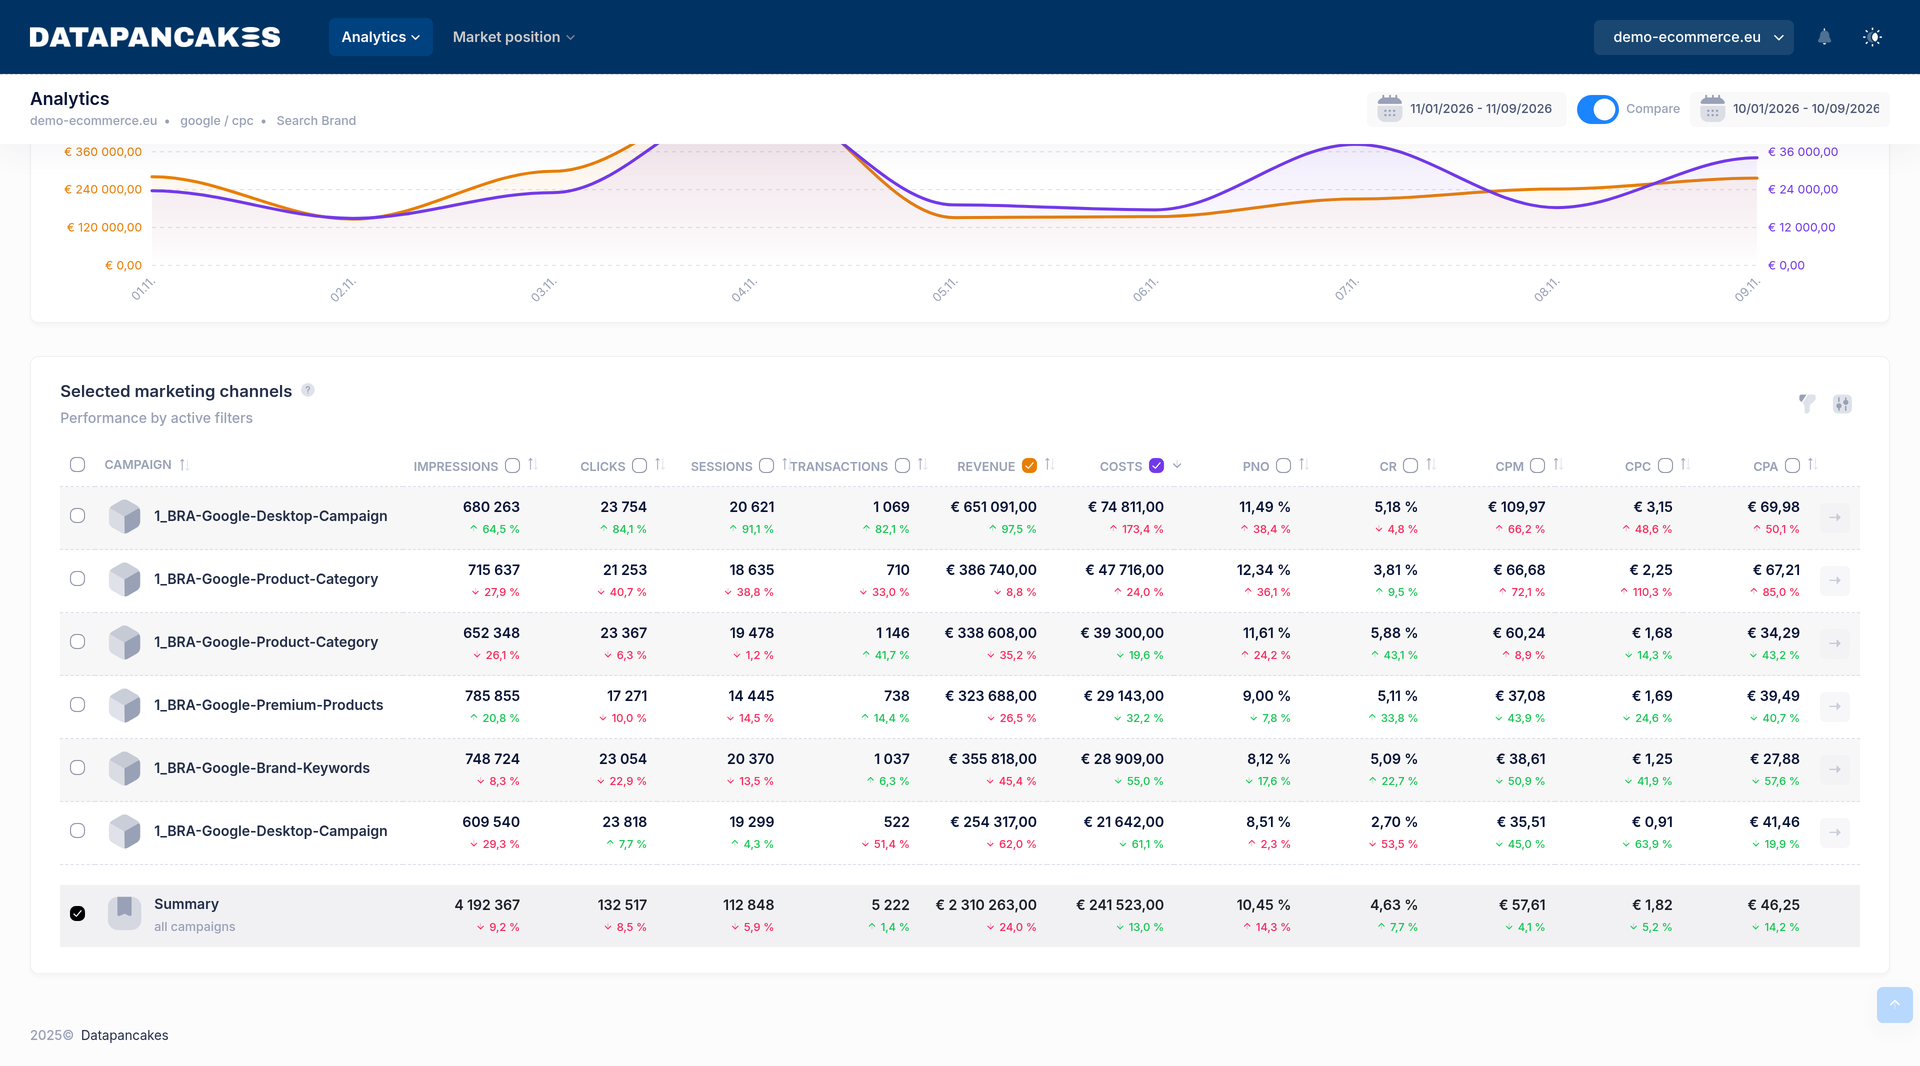
Total revenue, costs and metrics such as PNO (cost-to-revenue ratio) or ROI from every channel (Google, Meta, price comparison sites and more) in a single overview.
Budget control
See at a glance how budgets are being spent (overspend/underspend), by channel and by individual campaign.
Analysis in context
Track cross-channel effects and compare performance over time, month over month and year over year. Modular charts let you combine any dimensions and metrics to see how they relate.
Fast integration
Your dashboard is ready to use within 3 business days of receiving access.
Product analytics
Find out which products generate the most revenue and which need attention.
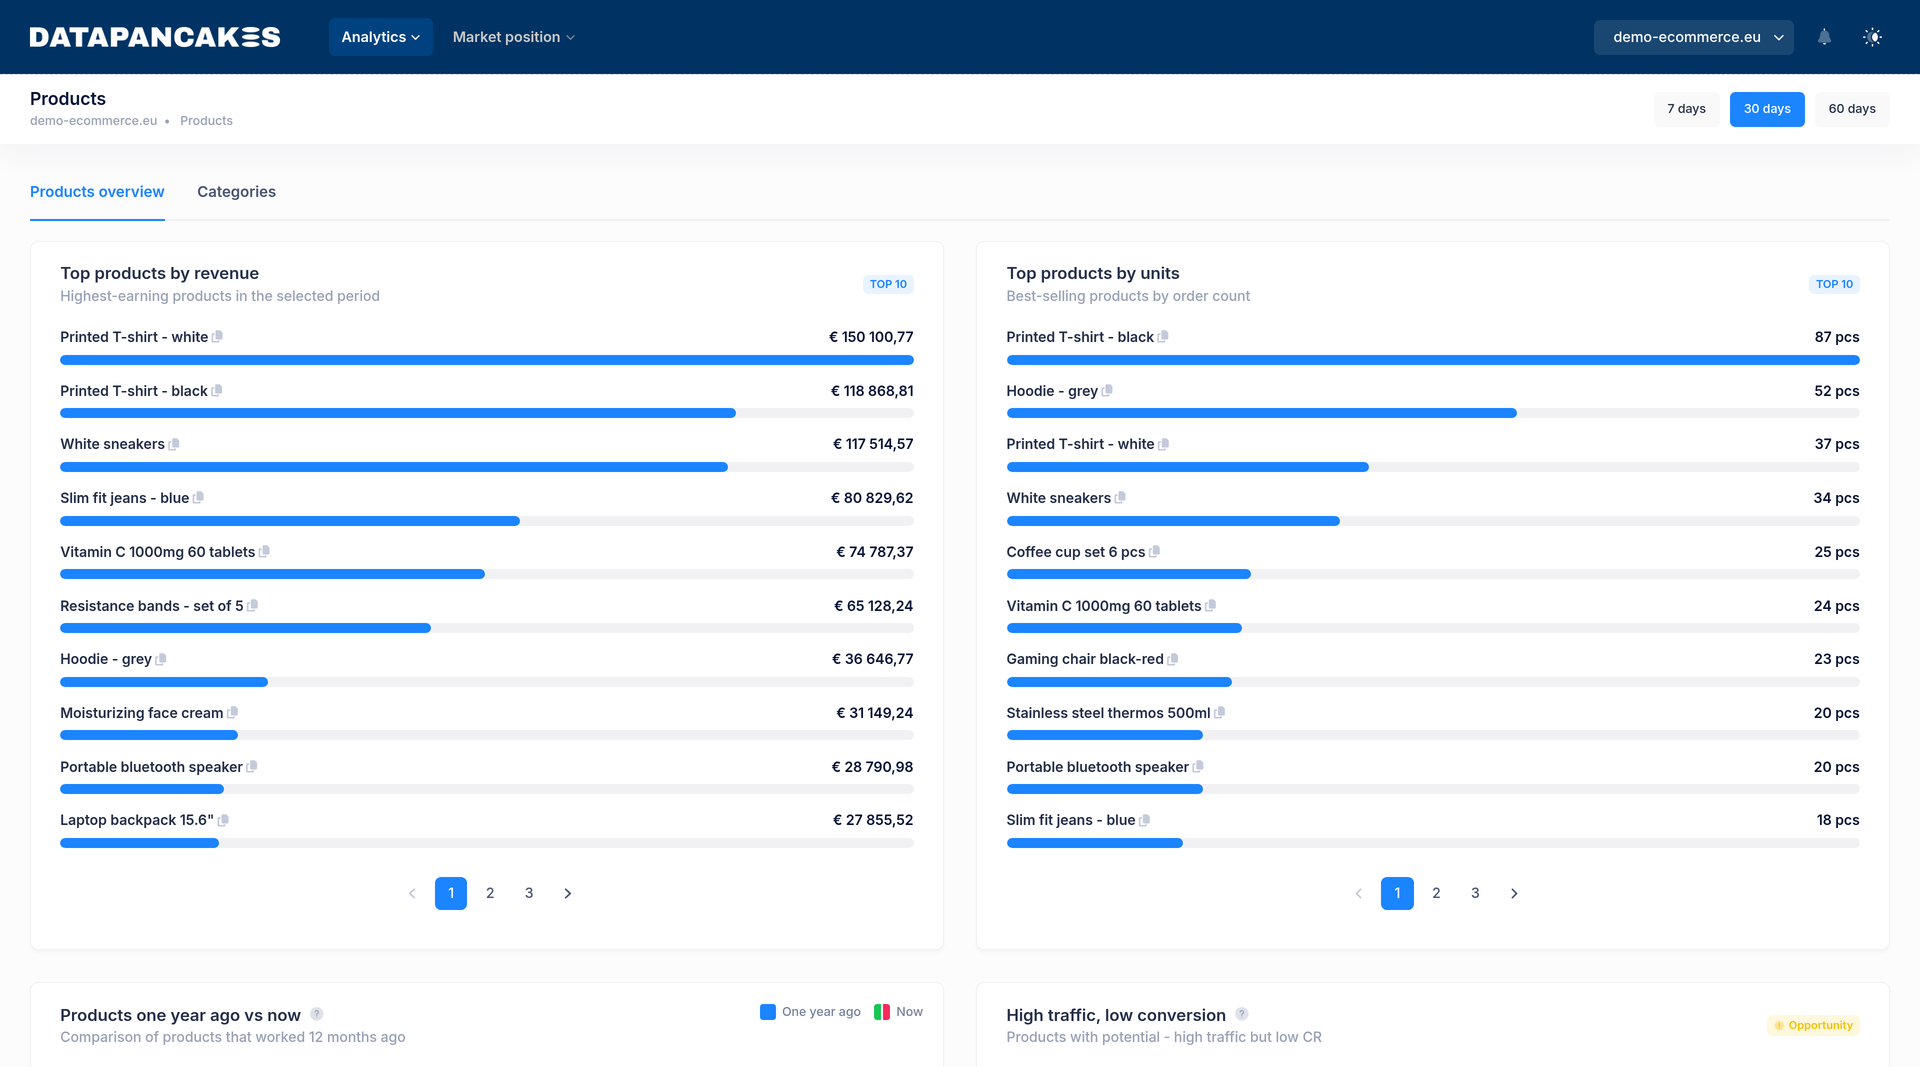
Performance Dashboard ranks products by revenue and units sold, compares them with last year and finds those with high traffic but low conversion — the places where you are leaving revenue on the table.
- Top products by revenue
- Top products by units
- Last year's bestsellers vs. this year's results
- High traffic, low conversion
Which products generate the most revenue
A ranking of your highest-revenue products over the last 7, 30 or 60 days. Bar length shows the gap from the top product, so you can immediately see whether revenue depends on one bestseller or a broader group.
“Which products drive our revenue?”
What sells most often
The same ranking by units sold. Compare it with revenue to distinguish low-priced products sold in volume from products with a high order value.
“Which products do customers buy most often?”
How last year's bestsellers perform today
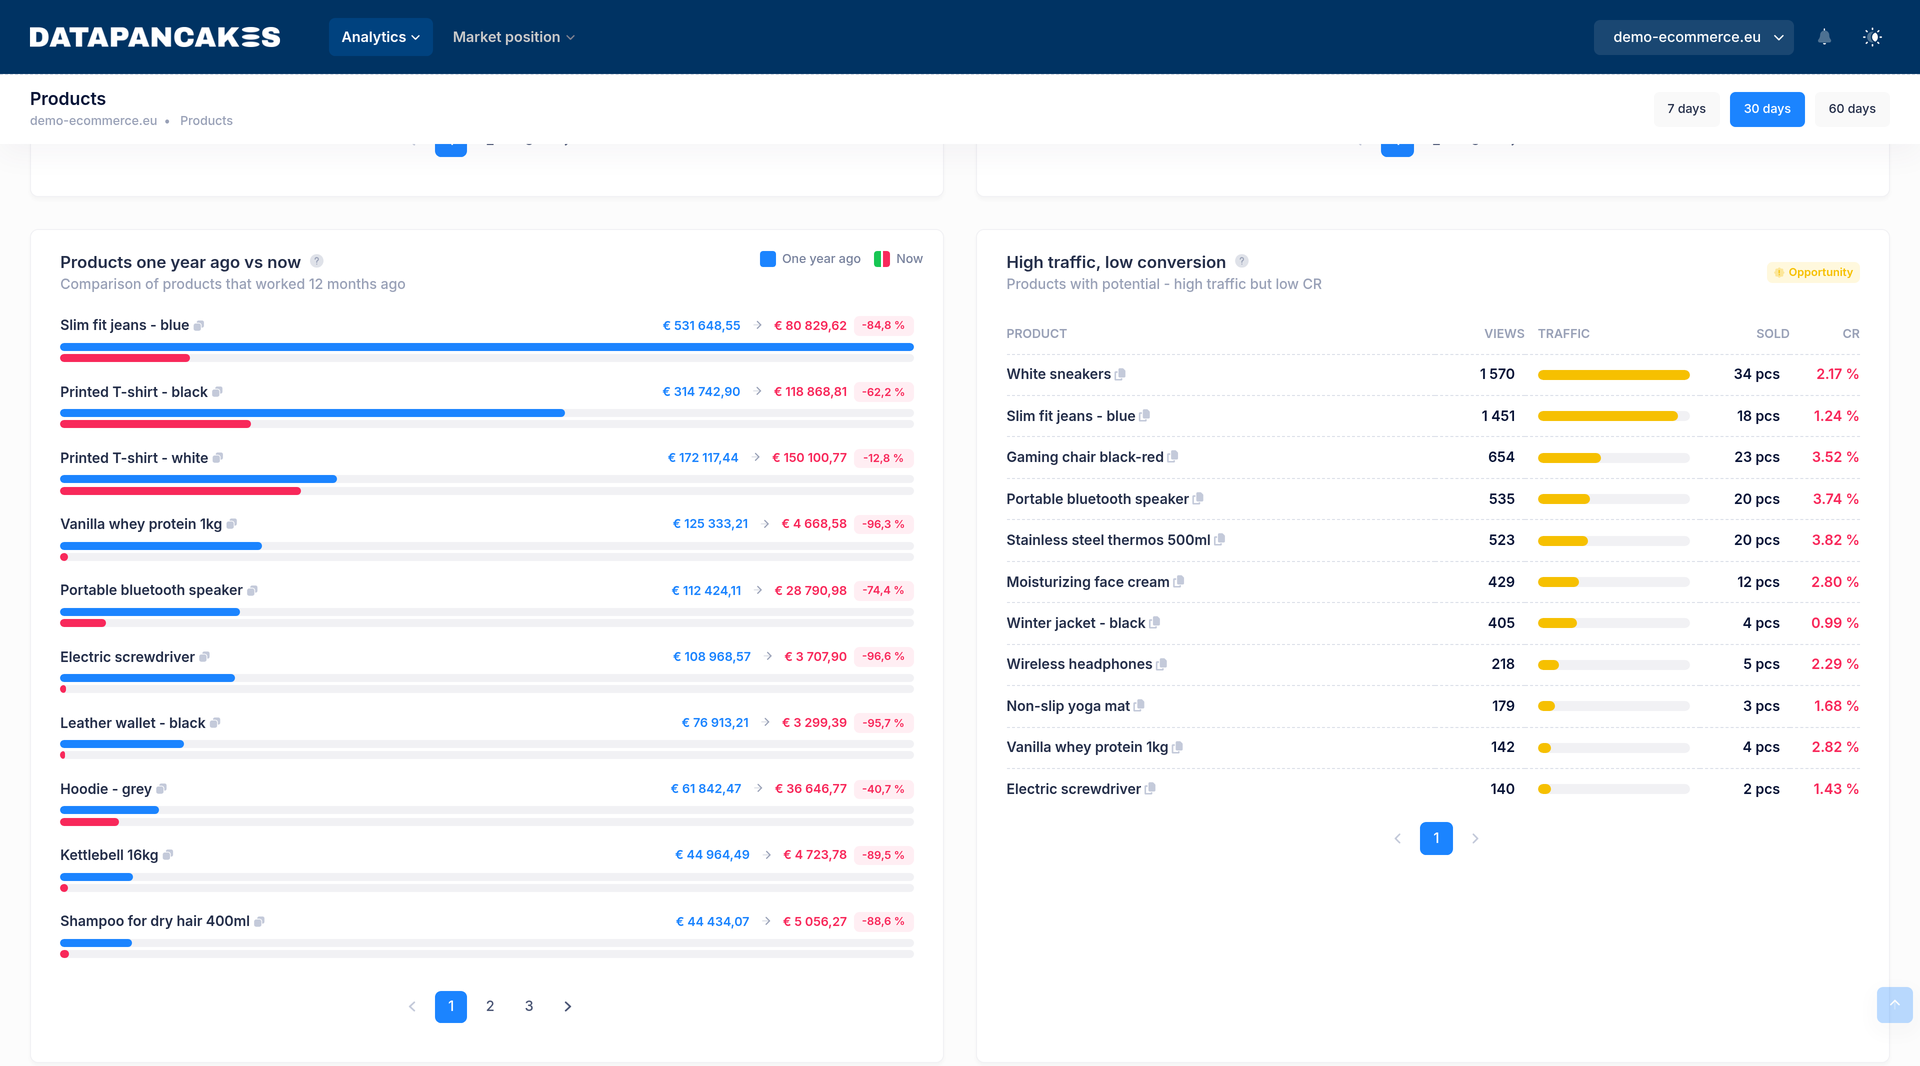
Compare products that performed well a year ago with today. See which former leaders are losing ground — in the demo, blue slim fit jeans are down 84.8% — and which are growing.
“Which of last year's bestsellers are quietly declining?”
Products with untapped potential
Products with more than 50 views that convert below your store's average, ranked by untapped potential. These are the best places to improve pricing, photos, descriptions or availability.
“Where are we losing revenue even though customers see the product?”
Explore product analytics yourself
The demo uses sample data. No registration required.
Category analytics
Find out which categories drive revenue and which hold it back.
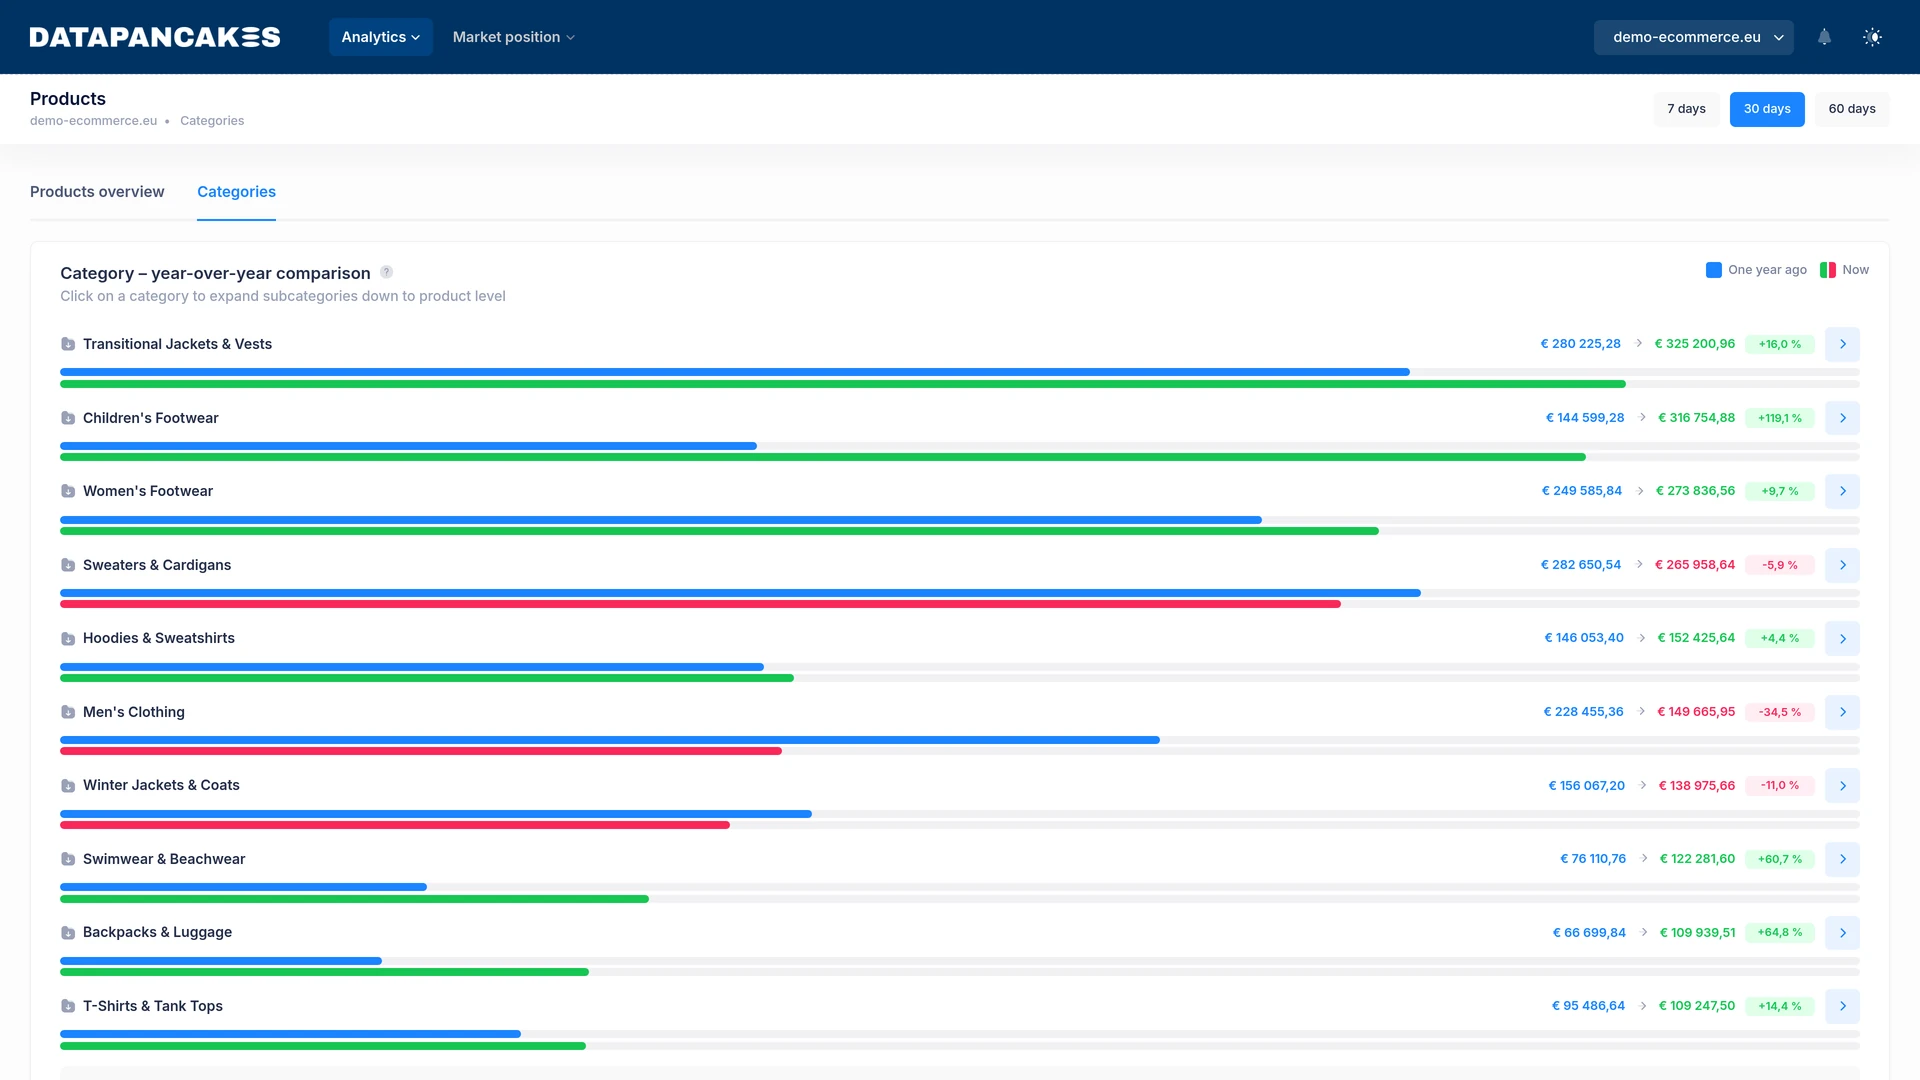
Performance Dashboard breaks down store performance by product category. Compare categories year over year, follow changes in your revenue mix, see where revenue comes from and whether customers are new or returning. Drill down into subcategories with one click.
- Year-over-year revenue comparison for each category
- Top categories' revenue mix this year vs. last year
- Paid, Organic and AI sources by category
- New vs. returning customers by category
Which categories are growing and which are losing ground
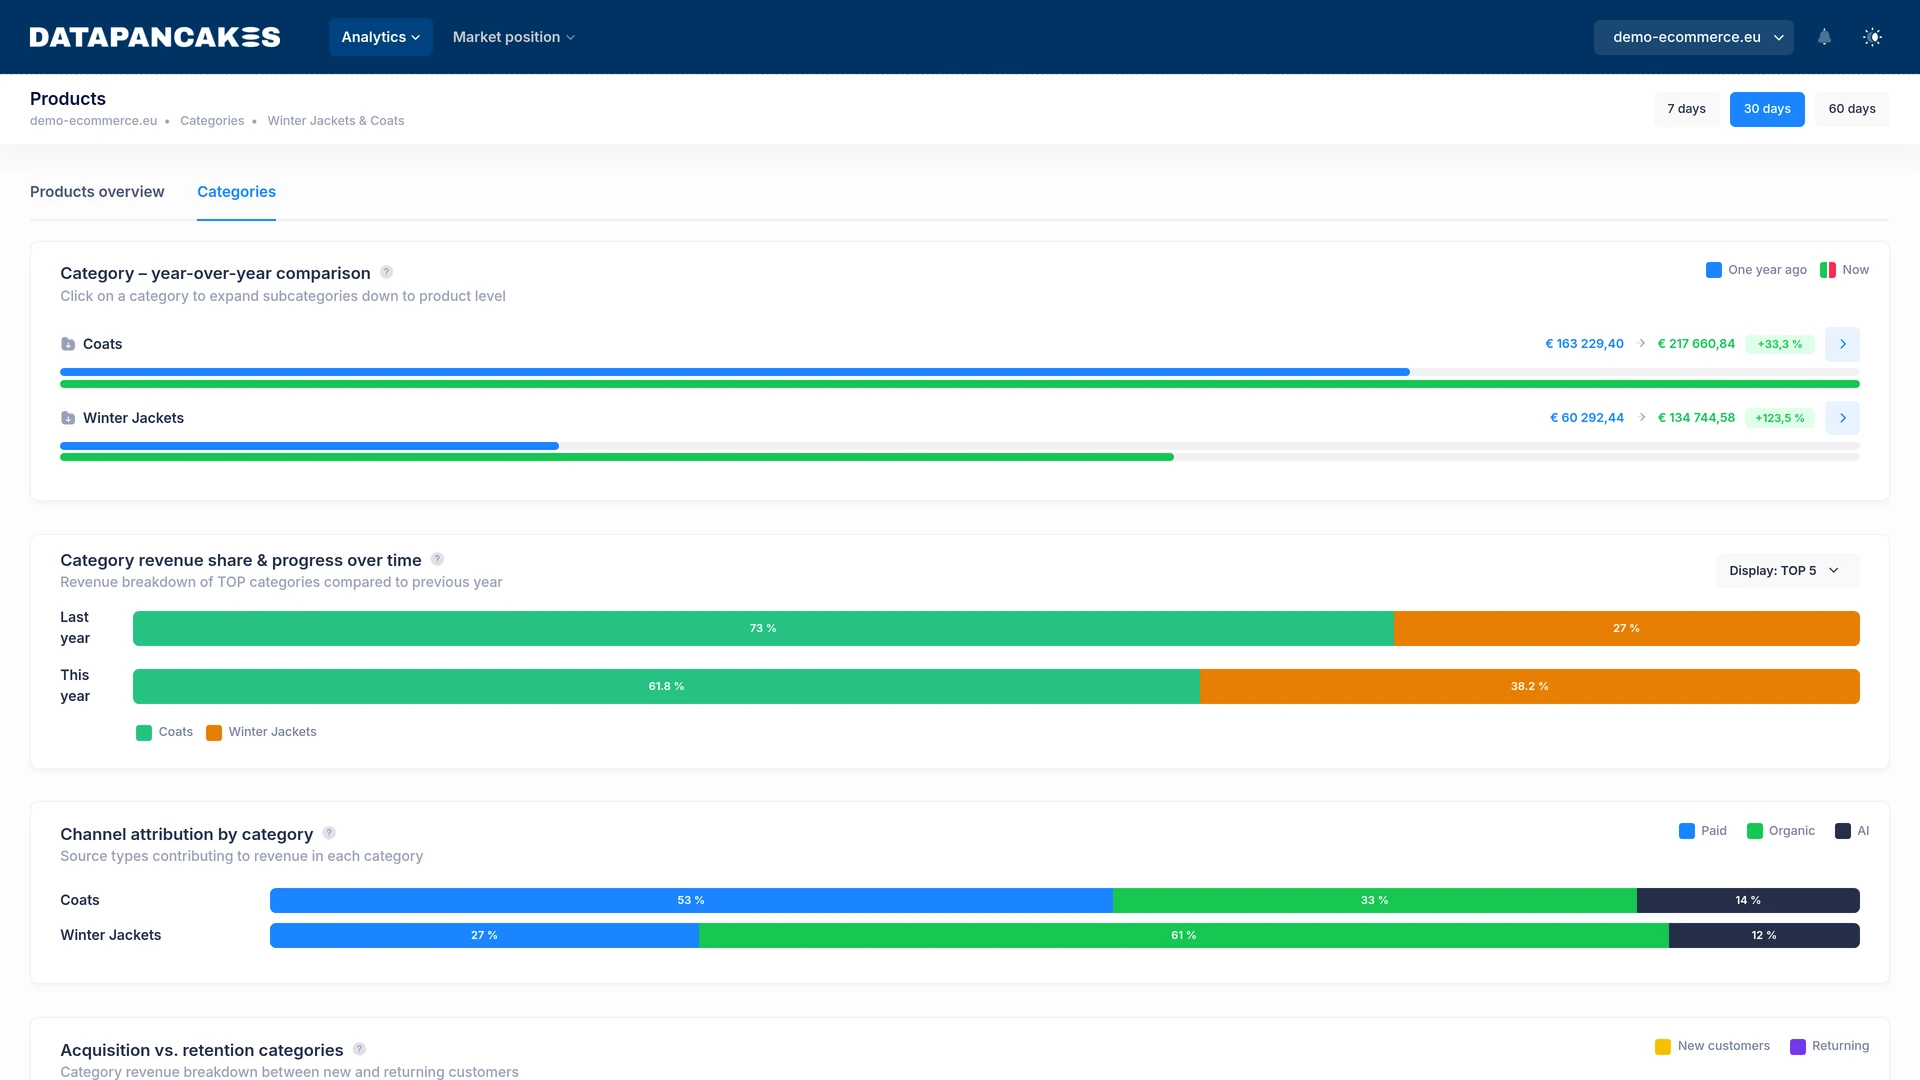
The blue bar shows category revenue a year ago; green or red shows revenue now. Exact amounts and percentage changes sit alongside it, so you can spot a decline before it affects your store's overall results.
“Which category is behind the decline in total revenue?”
Drill down into subcategories
Click the arrow next to a category to go one level deeper and update all charts for that category. In the demo's Winter Jackets & Coats category, coats are up 33.3% and winter jackets are up 123.5%.
“Is the whole category growing, or just one part of it?”
How your revenue mix is changing
Compare the revenue share of your top categories this year and last year. See whether growth depends on one category or is spread evenly, and how much revenue comes from the rest of your range.
“Are we too dependent on one or two categories?”
Where category revenue comes from
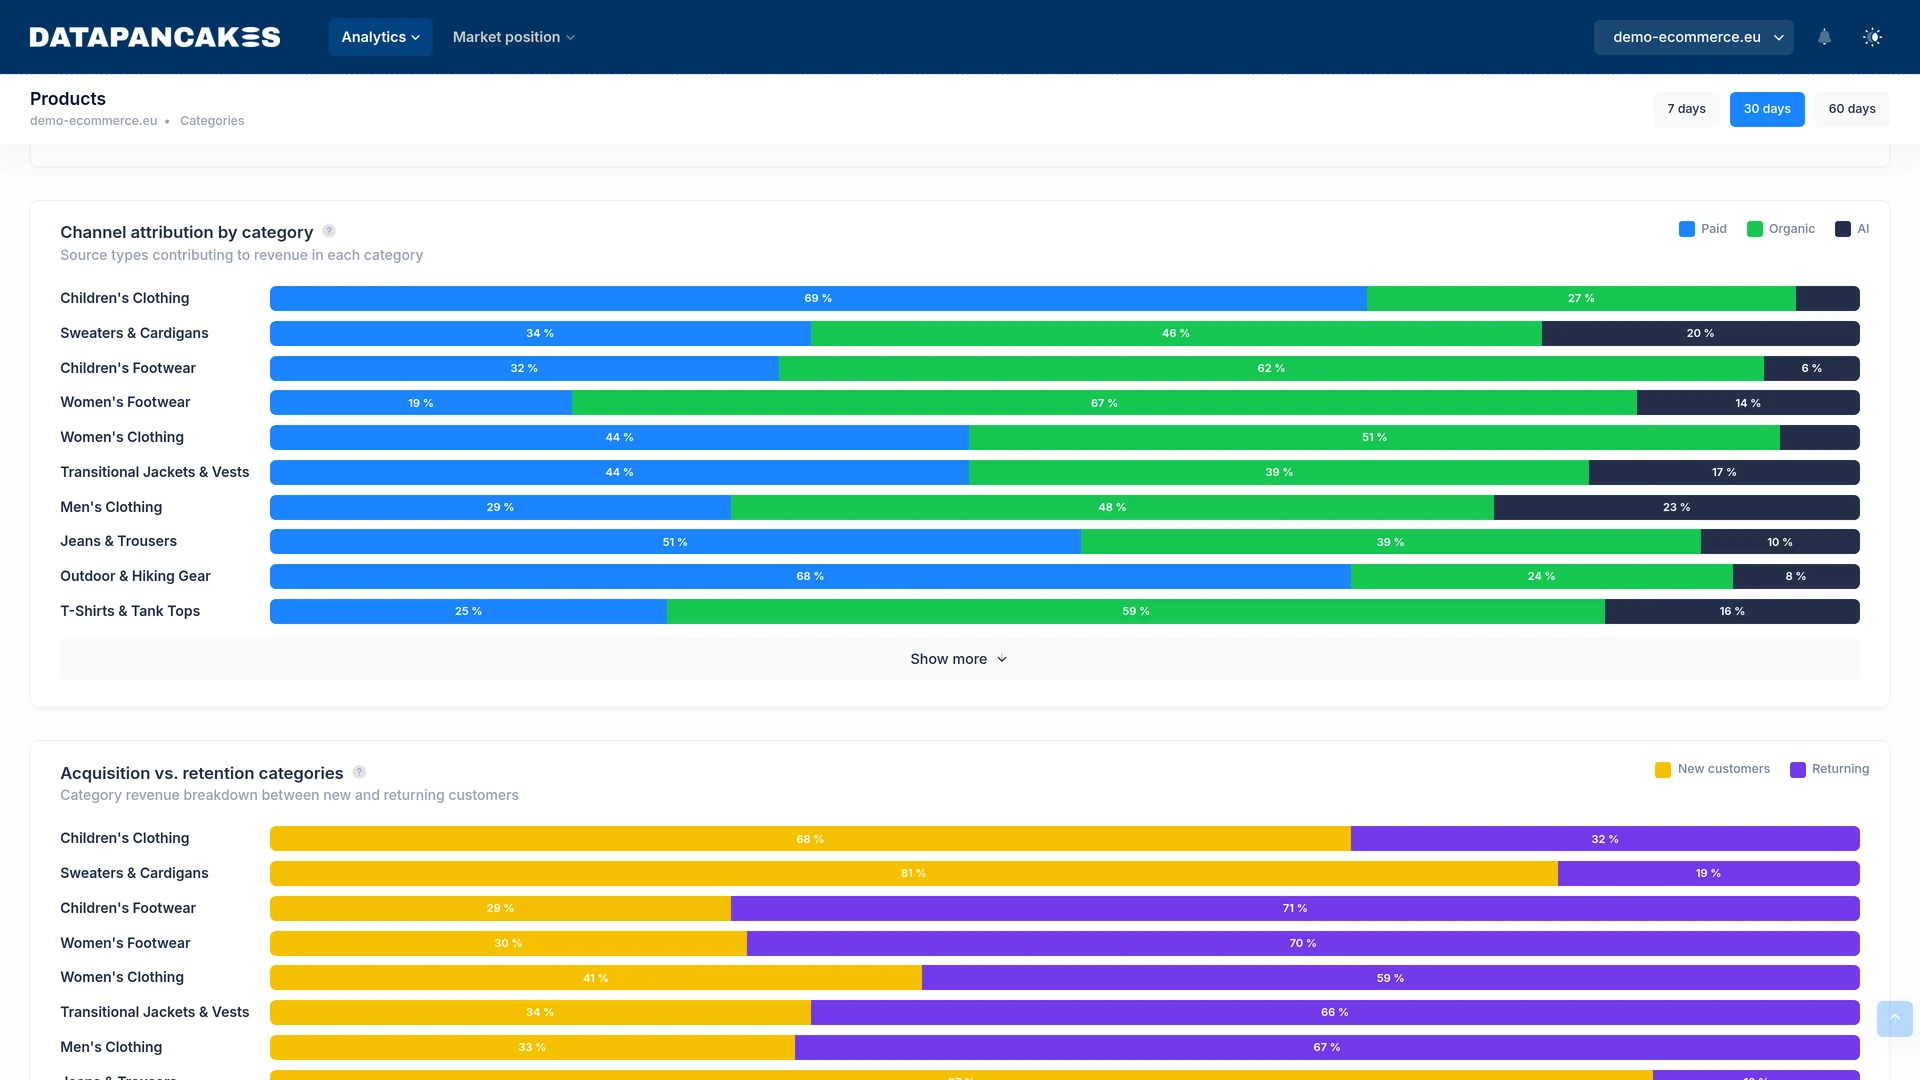
Break down each category's revenue into Paid, Organic and AI sources. Immediately see which categories depend on campaigns and where AI assistants are already sending customers.
“Which categories depend on paid advertising?”
Acquisition vs. retention categories
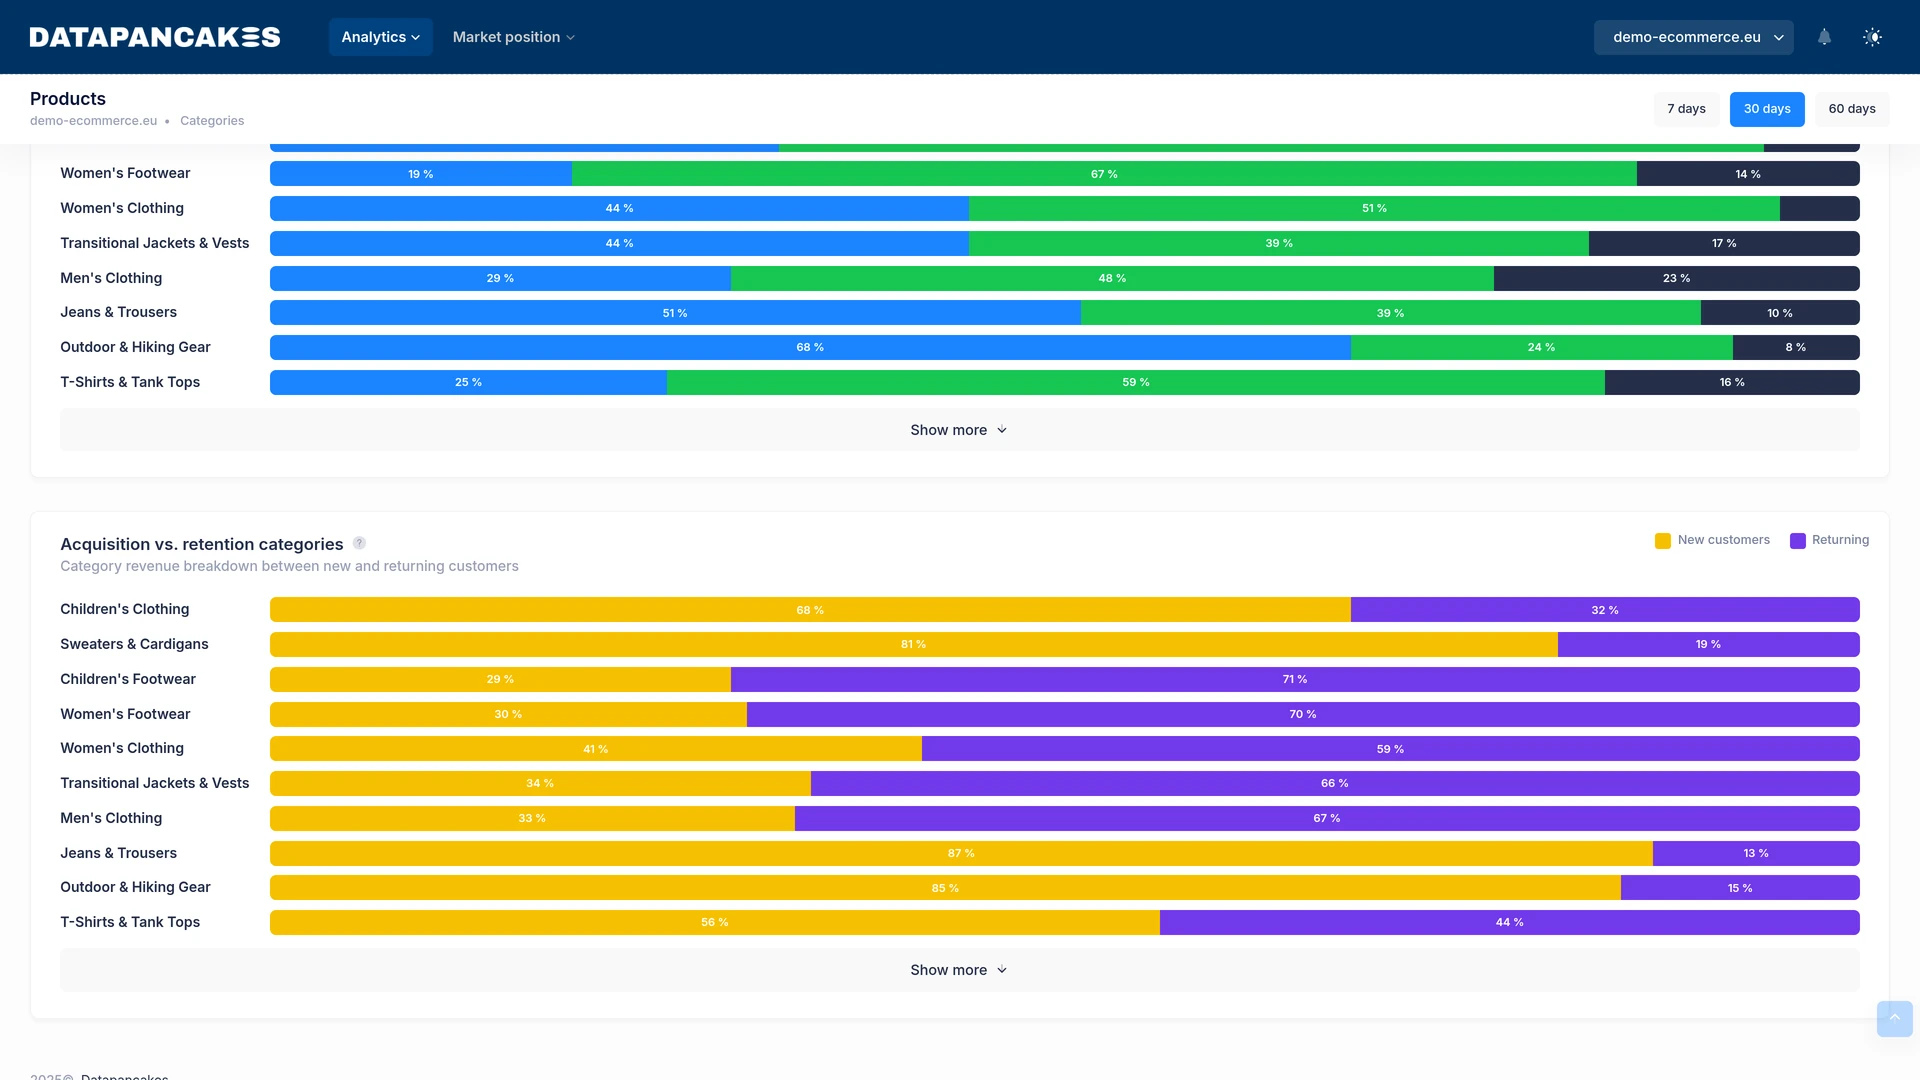
For each category, see how much revenue comes from new and returning customers. Use acquisition categories in new-customer campaigns and retention categories in remarketing, email and loyalty programs.
“Which products should we use to attract new customers?”
Explore category analytics yourself
The demo uses sample data from an online fashion store. No registration required.
How we beat standard reports
Lightning fast
Forget reports that take forever to load in Looker Studio. Our dashboard shows all your data instantly, so you spend your time on decisions, not on waiting for charts.
Proactive data monitoring
We spot a tracking outage or an anomaly in transactions before you do. We watch your data continuously and contact you as soon as a problem appears, so you don't lose valuable data.
Smart source cleanup and merging
We tidy up broken UTM parameters and fragmented sources. Data is merged right in the dashboard, with no changes needed in GA4.
Actionable product analytics
Identify products with high traffic but a low conversion rate. Compare year-over-year sales of individual products and whole categories, and get instant input for your marketing decisions.
Want to know more? Try the demo or request a quote.