Share of Voice (SoV) measures your brand’s share of advertising space and shows you where to invest effectively. Knowing it is essential when you want to grow dynamically, because that’s when you need to have a SoV higher than Share of Market. So you should invest not only in performance marketing, but also in awareness-building and consideration campaigns. This is because it is seen that companies that gravitate solely towards performance marketing lose growth momentum and eventually market share over time.


Share of Voice (SoV) measures your brand’s share of advertising space and shows you where to invest effectively. Knowing it is essential when you want to grow dynamically, because that’s when you need to have a SoV higher than Share of Market. So you should invest not only in performance marketing, but also in awareness-building and consideration campaigns. This is because it is seen that companies that gravitate solely towards performance marketing lose growth momentum and eventually market share over time.

Get an easy overview
of your competitors
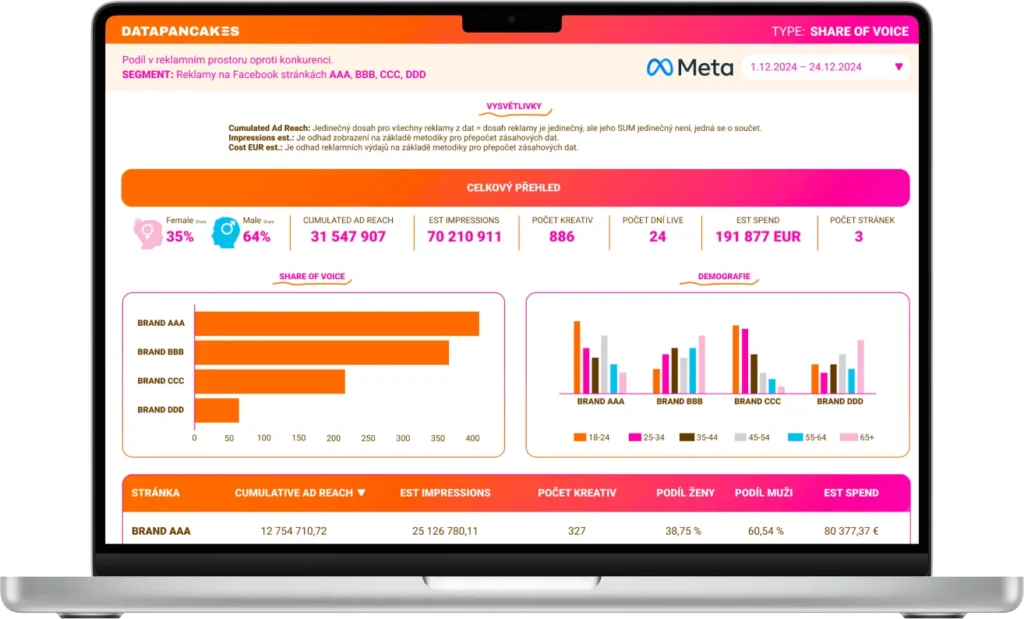
The SoV visualization in Looker Studio shows the unique reach, investment estimate and impressions on Google and META. Estimates are based on frequency of impressions and cost per thousand impressions. The report shows the distribution of investment and reach among competitors by demographics and region, and tracks cumulative reach over time for insight into competitor strength and activity.
1. Measurement of share in advertising space
If your Share of Voice is lower than Share of Market, you’ve probably under-invested in brand awareness and decision-making campaigns. This tool will show you when to adjust your strategy.
2. Understanding competitor marketing
By tracking Share of Voice with competitors, you can gain valuable insights into their marketing activities. Thanks to publicly available information from Ad Transparency libraries, you can find out on which platforms and how your competitors are investing.
3. Detailed overview of advertisements
Use the data to see how competitors are investing on platforms like Facebook, Google and TikTok, including reach, target audiences and insights on specific creatives. Share of Voice will show you the importance of these investments relative to overall reach.
4. Optimizing your own campaigns
Using proprietary algorithms, we recalculate the impression hit of competing campaigns and extrapolate ad spend using CPM benchmarks at the subtype level and in combination. We display Share of Voice data by category or keyword,
including spend, number of creatives, targeting and real impact. All available in Looker Studio with daily updates.
5. Effective marketing investments
Frequency and reach are key for brand awareness or consideration campaigns. It’s not enough to set a budget, but also a share of the advertising investment for the target audience. If you don’t know that competitors have spent more, your investment may be insufficient. Results also depend on the brand’s position in the market, so we recommend combining Share of Voice with brand research.
The Share of Search (SoS) metric shows how often people search for your brand versus your competitors, reflecting their interest and awareness. SoS has a strong correlation with a brand or product’s market share, and knowing it will help you better understand your market, optimize your marketing, and strengthen your position.
Get an easy overview
of your competitors
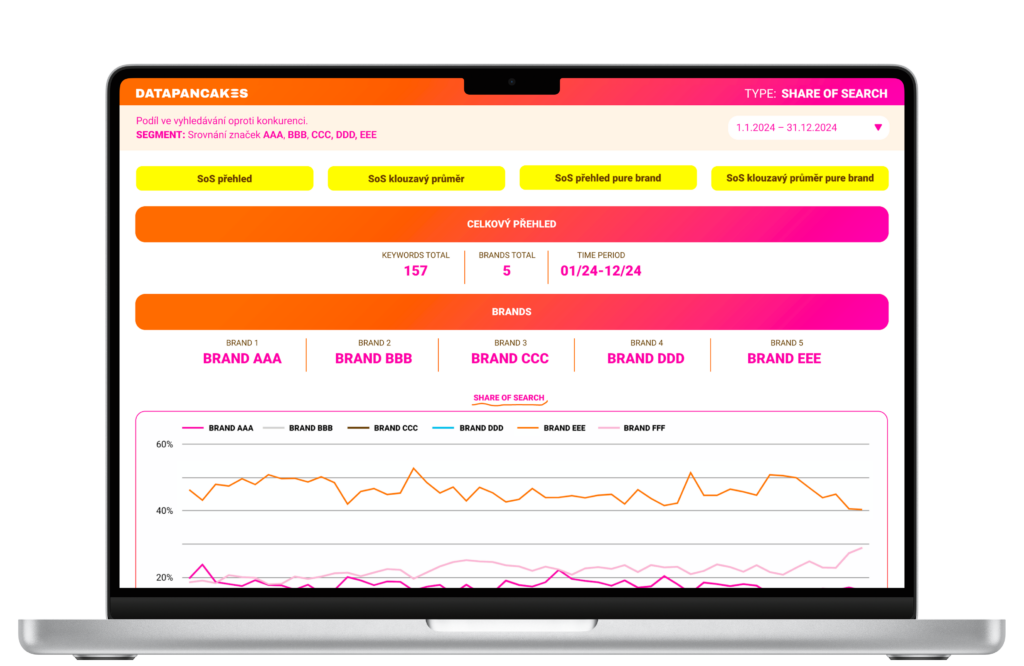
Looker Studio allows you to track absolute search share, six-month moving average trends and different levels of brand queries (pure brand terms or all queries containing the brand name).
The report shows:
– Search share trends for all included brands
– Search volume in a given industry
– Search share trends over time using both stacked and linear graphs
– Total search share over a certain period

1. Measuring brand awareness
If you find that your SoS is lower than your competitors, it means lower brand awareness. This metric will help you decide when to invest in brand awareness campaigns and content marketing.
2. Comparison with competitors
Tracking competitors’ SoS provides valuable information about their marketing activities. If it has a higher search share, it may be due to a stronger strategy, more investment in advertising or better brand awareness. This data can help you allocate budget more effectively and gain a competitive advantage.
3. Market share prediction
A high SoS often predicts sales growth, while a decline signals a threat to market share. By monitoring trends, you can react in time and adapt your strategy.
4. Marketing budget optimization
Share of Search allows you to allocate marketing investments more accurately. If competitors dominate search, it may be necessary to increase the advertising budget. Conversely, if you have a head start, you can focus on maintaining your position.
5. Identification of trends and new opportunities
Tracking changes in SoS helps to detect new trends and enables a quick response to competitors’ marketing campaigns. A rolling six-month average filters out short-term fluctuations (e.g. media cases) and provides insight into long-term trends.
 Cohort analysis
The key to understanding customer behaviour over time
The analysis tracks the behaviour of different customer groups over time and helps you understand how different factors influence their interactions with your brand. Track customer behaviour by registration, first purchase or other milestones.
 Identify trends in email open rates, click-through rates, and purchase behavior.
 Gain insight into how customers evolve over time.
 Tailor your marketing strategy based on real data.
 Cohort analysis of e-mail marketing database health
A basic step to effective email marketing
Find out if your marketing messages are still reaching your customers as effectively or if there are changes in their response rates. Evaluate whether your emails are opening and clicking the same way as time goes on.
 Identify whether new contacts respond differently than older customers.
 Uncover issues such as poor email deliverability or a decline in interest.
 Optimize email communications based on real data.
 Basic analysis of the e-mail marketing database
A healthy database as the basis for successful emailing
Helps you evaluate the quality of your email database, identify inactive contacts and improve overall campaign performance. Identify active vs. inactive customers.
 Reduce bounce rate and unsubscribes.
 Improve deliverability and engagement rates.
 Minimize the risk of penalization from email services.
 RFM Segmentation
Segmentation to reach every customer effectively
Segment customers by purchase frequency, purchase value and transaction recency for better campaign targeting. Identify your most valuable customers and work with them more effectively.
 Identify customers who are about to leave and prevent losses.
 Tailor personalised communications to individual segments.
 Increase repeat purchases and customer loyalty.
 Customer value analysis
Understanding customer value as the key to long-term growth
Find out which customers bring you the most value and how to work with them effectively. Track customer activity – from emails to purchases.
 Identify your most profitable customers and focus your marketing on them.
 Optimise your investment in acquisition and retention campaigns.
 Improve the overall customer experience.
 Retention analysis
The key to retaining your customers
Helps you discover why customers leave and how to avoid losing them. Identify the stages when customers are most likely to leave.
 Uncover the factors that influence loyalty.
 Create effective retention campaigns.
 Get clear recommendations for improving the customer experience.
 Customer Lifecycle Analysis
Optimise every stage of your customer journey
Map all the steps a customer goes through, from first contact to repeat purchases. Find out where customers are most likely to leave the process.
 Identify the key points of interaction.
 Improve the customer experience with personalized communication.
 Increase conversion rates and customer value.
 Segmentation by communication channels
Targeting the right audience the right way
Find out which communication channel is most effective for your customers and adapt your strategy. Track how customers interact with different communication channels.
 Optimise campaign targeting according to customer preferences.
 Maximise efficiency and ROI.
 Ensure your message reaches the right people in the right way.
 Clear data visualization – intuitive dashboards and reports.
 Fast implementation – first results in just a few days.
 Connection to your data – CRM, social networks, analytical tools.
 Actionable recommendations – no complex numbers, but concrete steps.
Datapancakes is a Business Intelligence Hub where we help companies transform raw data into clear and understandable information. Our recipes facilitate strategic decision making, improve customer retention and optimize marketing processes. We specialize in collecting, analyzing, visualizing and interpreting data from various sources such as social networks, CRM systems, analytics tools or other enterprise platforms.
Many companies already have a “data pantry” but often lack the practical insight to turn data into something actionable. Our solution builds on your existing systems and delivers specific pre-packaged analytics focused on key areas of the business, such as improving customer retention, among others. At Datapancakes, we not only help you interpret the data, but we can also add a dash of marketing automation so you can serve up new insights in your customer communications. Together, we’ll gradually bake data insights that fit your needs.

The Datapancakes business intelligence hub is designed for companies of all sizes that want to fully leverage the potential of their data, optimize marketing activities and better understand their customers. Our solution is most appreciated by business owners, CEOs and marketing managers, providing them with clear reports and unique insights that facilitate decision-making and support effective strategy management. Our goal is to help those who not only have the expertise, but also the power to make changes that will grow their business.
Datapancakes works as a comprehensive tool for data collection, analysis, visualization and interpretation. First, we work with you to define goals and key metrics. Then we automatically collect data from systems such as CRMs, advertising platforms, social networks or analytics tools. The data is then processed using advanced algorithms to cleanse, unify and prepare it for analysis. The results are presented in intuitive reports and visualizations that make it easy to understand and use the insights gained. Finally, we provide recommendations for implementing the data insights into your strategy and ensure regular updates to the reports.
You can integrate data from various sources such as CRM systems, social networks, analytics tools and other marketing platforms. Integration of data from e-commerce platforms is also supported to analyse sales, customer behaviour and other key indicators. In addition, the solution works with external data sources. Datapancakes Intelligence Hub is flexible and analytics can be tailored to the specific systems you use in your business to provide maximum value.
The process of connecting client systems is fast and tailored to your needs. First, we work together to identify the data sources you want to integrate, such as CRMs, e-commerce platforms or analytics tools. We then provide the necessary access and connectivity via APIs, data exports or direct connection to cloud services. Our specialists will take care of the technical setup, verify data consistency and customize the platform to your specific requirements. For less complex analyses, such as Share of Voice, you’ll have access to reports within days. For more complex analyses, such as RFM segmentation, the speed of delivery depends on the quality and completeness of the data you provide. Once the connection is complete, the data is tested, validated and interpreted so that you can use the insights immediately.
The Datapancakes platform offers a wide range of reports focused on data analysis and strategic decision support. Key reports include Share of Voice, which shows your brand’s share of the ad space, and Share of Search, which tracks how brands are being found compared to competitors. Reports are also provided for cohort analysis tracking customer behavior over time and RFM segmentation, which categorizes customers based on their purchase activity. We also offer retention analysis to identify key retention factors and customer lifecycle reports that map the customer journey from first contact to repeat purchases. All reports are visualized in a clear and intuitive way to make them easy to understand and use to improve your strategy.
Reports are preset and based on best practices. If you need specific adjustments, they can be customized by individual agreement.
Datapancakes makes everyday decision-making easier by providing clear reports and actionable analytics that can be immediately applied to everyday decision-making, whether it’s optimizing campaigns, improving customer experience, or other strategic activities.
Prices for our services start at a few thousand crowns per month for basic analysis. The exact price depends on the scope and quality of the input data you provide. Detailed pricing information can be found in the individual products, or contact us for a customized quote.
The length of implementation depends on the type of analysis and the quality of the input data. For pre-configured analyses with well-prepared data, results can be delivered within a few days. For more complex projects that require customization or larger volumes of data, implementation can take a few weeks. We always try to streamline the process as much as possible to get you results as soon as possible.
Yes, part of our service includes help with data interpretation. In addition to delivering clear reports, we will provide you with specific recommendations on how to apply the findings to your strategy. Our team of specialists can offer consultations to help you better understand the results of the analysis and find ways to use it most effectively to support your business.
Would you like to meet in person?
You can find us in Prague at:
Budějovická 778/3
Prague 4
And if you’re far from us, we can connect online. Or we can come to you.
E-mail:
hello@datapancakes.com
This is the website of ACOMWARE s.r.o., with registered office in Prague 4 – Pankrác, Budějovická 778/3, Postal Code 140 00, ID No.: 25047965,
, registered in the Commercial Register maintained by the Municipal Court in Prague, Section C, Insert 92586.